Showing posts with label Analytics Marts. Show all posts

Monday, March 7, 2016

Is enterprise ready for Analytics Marts?

Observing consultants and IT organizations implement large business intelligence solutions, I find often that the first project either fails entirely or never gets past the initial phases. Lessons learned from these setbacks are often rooted in the client/ business not knowing the data they really want or political battles over which information and metrics are most important. Technical architects have avoided such battles by instead providing data marts, so that managers can help themselves to any data and build metrics in a self-service manner. By giving the client or business everything, the problem is solved.
But does this approach really help the business in the end? No. Managers remain misaligned serving their best guess of what will get them praise instead of addressing the true business need. Internal to the organization, data proliferation occurs where meanings get blurred and maintenance is so difficult even labels lose their original purpose of a sufficient description. Data silos of big data proportions are saved per division which is wasteful and duplicative.
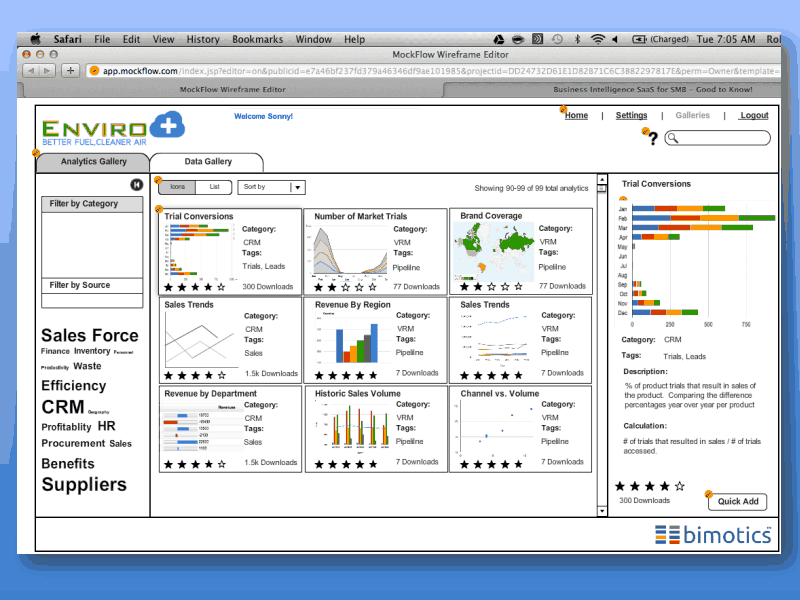
Generally, I am describing an enterprise problem. Small and medium-sized businesses (SMB) suffer less from these political problems as they cannot afford much system customization and the resources needed to maintain it. Instead the SMBs tend to stick with the standard and best practice fields and data points. Because of this, Bimotics can provide our customers a solution we call the “gallery of analytics”. This gallery hosts all the business analytics available given the operational and financial application data marts for which the customer has data.  Generally, these pre-built analytics reflect best practice operational and sales processes that are fundamental in all business looking to grow. The image below is an example of what the analytics gallery looks like.Is enterprise ready for Analytics Marts?
The value to business owners is that they do not need to know what metrics they want before they bring on analytics. Instead they pick and choose the available analytics that makes sense to answer a particular business problem. They also can prioritize these analytics based on the business strategy they laid out.  If the business changes direction, then the business owner can change out the analytics to reflect this new vision. Not having to go back to the drawing board saves precious time. This gallery approach to analytics puts the definition and the prioritization of metrics and at the end as well as provides breadth and flexibility to a manager.  
Can this same principle be applied to solve an enterprise problem? Although very complex to build, can an “analytics mart” based on only the standard fields and best practice processes of major enterprise applications such as SAP, Oracle, Microsoft and SalesForce be built using the similar principles as our “gallery of analytics”? This “analytics mart” would cut across the different platform so that advanced metrics are available. For example, metrics, like support center effectiveness, are shown as a blend of financials in SAP with support data from Siebel. This proposed approach solves one of the greatest barriers that keep enterprises from successfully implementing business intelligence, by defining what to measure up-front, avoiding the interdepartmental politics in its allegiance to only standard and best practice processes.
Why haven't companies implemented "analytics marts" already? The answer is twofold.  First building an analytic mart across enterprise systems houses many technical complexities especially when looking at all the software versions and system customizations that exist per enterprise. This is not to say that a solution is technically impossible however.  Second, budgets split by division and departments need to be continuously spent in full which enable data silo behavior over cross department collaboration and process analysis. In other words, large organizations have budgetary policies that encourage managers to make blind purchasing decisions.   How much of a fundamental shift would need to occur in an organization to embrace the sharing of data and metrics sharing?
The key to customer adoption of the analytics mart rests on a consolidated drive to improve your business and the willingness of managers collaborate holistically. Will enterprise managers have the courage to allow themselves to be measured against fundamental business process standards, in addition to evaluating how well their assigned divisions support the overall corporate strategy?

Tuesday, January 7, 2014

The true bottom line

What is your bottom line?  
That is the question most everyone running a business is asked. But the exact meaning is often misunderstood as gross profit. Indeed the bottom line is actually net profit or net profit on sales. It is the company's reported income after everything is taken into consideration- taxes, normal operating revenues and expenses, extraordinary charges, and  financial income. Owner value increases as net profit increases by adding to the company’s retained earnings.  At the end of the day net profit is the key metric to answering the question “what’s in it for me”?.
Because net profit represents the bottom line, all business factors drive this number. When analyzing your operations, it is essential to figure out what is impacting your bottom line. Experts have actually recommended that incentives not be based on the net profit metric because they say the average employee (not the CEO) cannot easily tie their day to day tasks to impact on net profit. Since it is an aggregate it blurs individual contributions, it is not meaningful in explaining what one task needs to be done better and thus doesn’t seem controllable. The bottom line should always be reviewed as the roll up of what it happening.
How Bimotics can help:  Your company’s bottom line is easily accessible through Bimotics if you use Quickbooks accounting software. Since we connect directly to the application, bringing in this metric to your dashboard is as simple as selecting it from the Bimotics analytics gallery.  As a summary or roll up metric, you need to look at this metric quarterly.  Analyzing trends your net profit and profit margin on a quarterly basis will give you and your shareholders a good idea on how well you are paying out.

Tuesday, September 24, 2013

Data marts, Analytics marts and Dash marts, Part 3 of 3

As described in our first part of this 3 part series, dash marts are the culmination of the data marts and the analytics marts. The dash mart is a concept from Bimotics that allows to integrate multiple analytics marts into a dashboard. But, what is new about this? Although most dashboards are a collection of charts and tables organized to provide a specific view to your business. The dashmart is not. A dash mart is more than a template. Bimotics dashmarts are built on top of data marts and analytics marts. Through categorizations and a strong understanding of business dependencies and relationships, the dash mart weaves together dashboards together for a more meaningful view of the big picture. We have built you a smart asset to win over your competition by combining the three concepts- data marts, analytics  marts and dash marts.
Dash marts leverage data marts as their foundation, as described on our series (Part 1: data marts). Data marts integrates convert and make easy for consumption the information from applications use by business like Quickbooks, Freshbooks and SalesForce.
As described also in the second part of this series (Part 2: Analytics Marts) the analytics marts, is at this level where business can gather real insight about meaningful questions related to a data mart. Here looking at each individual chart is key. Multiple insights can come by just looking at one analytic-one core measurement. For more an example using sales representative profitability see our first white paper.
The dash mart provides the “Aha! moments”, while analytics marts provide very meaningful insight they are limited by the data mart. With dash marts you are free to use analytics from multiple data sources on demand and most important provide the big picture to business. They are bound by filters that cross analytics through a common fiber. For example, dash marts that combine analytics from finance and CRM could generate very complex scenarios in a very simple way to analyze them. First, mixing financials with a CRM is the only way you can get sales representative profitability. In the same view, combine the your sales funnel from leads to cash.  Layer in product velocity vs. profit impact. Now you have the richest sales dashboard possible.
Our dash mart enables a forward view of your business- no more reliance on snapshots and historics. It also allows to monitor while you run it. Please checkout how Bimotics implements dash marts and how they could help you.

Thursday, September 5, 2013

Evolving from data marts to analytics marts - part 2

In our previous blog entry, we illustrated the value of data marts over complex spreadsheets.  While data marts help you and businesses focus more on analysis and less on dealing with raw data, they are just one foundational building block of a smart business.  
Data marts benefit businesses by converting often-immense source data from multiple subject matter silos within a business (eg. operations and/or finance) into a  more user-friendly product that is easier to analyze by the end-user. Getting usable data is key, but to have a truly intelligent business, metrics and analytics need to be defined and applied.
Bimotics asked the question, ”How can data marts be made even more streamlined?  Refined?  Intuitive? Can they provide answers to questions customers had not even asked yet?”  

Enter analytics marts – the evolution of the data mart.  The analytics mart is a concept pioneered by Bimotics that provides great analytical insight into information gathered from data marts through a gallery of plug and play charts that automatically adjust to your data, and most importantly, your business. From the moment you fire up the Bimotics console, you have ready to use analytics available at your fingertips.  The below image conceptually depicts how the analytics mart works.  Instead of having to build each chart from scratch and figure out the appropriate visualization for the information you have, simply click on the pre-built chart 
you want.


Analytics marts are individually tailored groups of business essential analyses that can be gathered from one or more data mart.  At Bimotics, these analytics come pre-packaged into categories like customer analysis, profitability and financial performance.  This categorization into intuitive grouping is at the heart of the analytics mart concept- pick and choose the charts and metrics built from your data marts that make sense and align with the business strategy and model of today.  Change them as quickly as your business transforms. Be agile!  If you are looking for revenue performance, for example, we have provided the metrics and charts  in the financials category .  You can also search analytics by tags such as revenue and financial performance.

The bottom line is that analytics marts allow you to focus your efforts on the actual analysis and gaining of insight instead of fretting over building charts. The visualization itself also aids  in the quick evaluation of your data.  It allows you to look at your information from multiple angles quickly and efficiently. Analytics marts are essential for detailed analysis, Key Performance Indicator (KPI) monitoring, and applying operational insight to process control.

The third part of the series ties it all together. Bimotics introduces the concept of the dash mart, an approach that combines analytics marts and data marts to give you an extraordinary view of your business.   

Wednesday, August 21, 2013

Is enterprise ready for Analytics Marts?

Observing consultants and IT organizations implement large business intelligence solutions, I find often that the first project either fails entirely or never gets past the initial phases. Lessons learned from these setbacks are often rooted in the client/ business not knowing the data they really want or political battles over which information and metrics are most important. Technical architects have avoided such battles by instead providing data marts, so that managers can help themselves to any data and build metrics in a self-service manner. By giving the client or business everything, the problem is solved.


But does this approach really help the business in the end? No.  Managers remain misaligned serving their best guess of what will get them praise instead of addressing the true business need. Internal to the organization, data proliferation occurs where meanings get blurred and maintenance is so difficult even labels lose their original purpose of a sufficient description. Data silos of big data proportions are saved per division which is wasteful and duplicative.


Generally, I am describing an enterprise problem. Small and medium-sized businesses (SMB) suffer less from these political problems as they cannot afford much system customization and the resources needed to maintain it. Instead the SMBs tend to stick with the standard and best practice fields and data points. Because of this, Bimotics can provide our customers a solution we call the “gallery of analytics”. This gallery hosts all the business analytics available given the operational and financial application data marts for which the customer has data.  Generally, these pre-built analytics reflect best practice operational and sales processes that are fundamental in all business looking to grow. The image below is an example of what the analytics gallery looks like. 
The value to business owners is that they do not need to know what metrics they want before they bring on analytics. Instead they pick and choose the available analytics that makes sense to answer a particular business problem. They also can prioritize these analytics based on the business strategy they laid out.  If the business changes direction, then the business owner can change out the analytics to reflect this new vision. Not having to go back to the drawing board saves precious time. This gallery approach to analytics puts the definition and the prioritization of metrics and at the end as well as provides breadth and flexibility to a manager.  


Can this same principle be applied to solve an enterprise problem? Although very complex to build, can an “analytics mart” based on only the standard fields and best practice processes of major enterprise applications such as SAP, Oracle, Microsoft and SalesForce be built using the similar principles as our “gallery of analytics”? This “analytics mart” would cut across the different platform so that advanced metrics are available. For example, metrics, like support center effectiveness, are shown as a blend of financials in SAP with support data from Siebel. This proposed approach solves one of the greatest barriers that keep enterprises from successfully implementing business intelligence, by defining what to measure up-front, avoiding the interdepartmental politics in its allegiance to only standard and best practice processes.


Why haven't companies implemented "analytics marts" already? The answer is twofold.  First building an analytic mart across enterprise systems houses many technical complexities especially when looking at all the software versions and system customizations that exist per enterprise. This is not to say that a solution is technically impossible however.  Second, budgets split by division and departments need to be continuously spent in full which enable data silo behavior over cross department collaboration and process analysis. In other words, large organizations have budgetary policies that encourage managers to make blind purchasing decisions.   How much of a fundamental shift would need to occur in an organization to embrace the sharing of data and metrics sharing?

The key to customer adoption of the “analytics mart” rests on a consolidated drive to improve your business and the willingness of managers collaborate holistically. Will enterprise managers have the courage to allow themselves to be measured against fundamental business process standards, in addition to evaluating how well their assigned divisions support the overall corporate strategy?