Showing posts with label Small Business Reporting. Show all posts

Monday, March 7, 2016

Too Small for Business Intelligence?

When we first formed Bimotics, we saw a large gap between the variety of business intelligence options available to large enterprise and the slim pickings available to small and medium sized businesses (SMBs). We knew we could build a service that addressed the data analysis needs of smaller companies. As we discussed our idea with the community, many asked whether automated business analytical reports was really needed by small businesses. They were most likely envisioning “mom and pop” operations with time-proven processes that yielded predictable profit margins, and they would be justified for asking that question in that context. We, however, like to define these businesses as “micro-businesses”, not SMBs. 
Never_to_small_for_bi
Is business intelligence technology overkill for small businesses? I think not. Bimotics defines our target small and medium sized business segment as organizations with at least 20 employees and revenues of at least one million dollars. You see, teams of employees spanning multiple departments inevitably generate vast amounts of distinct data, making the need to organize and analyze this data imperative.  Here are a few points on how business intelligence can bring basic value to any small business.
Real-time Gross Margin
Understanding gross margin is essential to small businesses. Sales that rise disproportionately to gross margin can actually set a business back- requiring even more sales to make up for lost ground. Not only does gross margin show the relationship between costs and sales, but it indicates the quality of sales being made. Entrepreneurs and sales teams alike can over commit to making sales when they are hyper-focused on revenue goals and commissions.  The risk of this over commitment is truly real.  Keeping an eye on this key analytic as sales come in rather than at the end of a quarter can boost the discipline needed to keep gross margin high. Studying gross margin side by side with the spending profiles of your customers will help indicate which relationships your account managers should prioritize and develop, and which ones should be placed on the back burner. 
Cash Flow Projections
Cashflow_from_Operations
For start-ups in particular, understanding the length of your cash runway is critical.  Burning through cash reserves before product sales take hold will keep you grounded. Business analytics is a great way to help you monitor cash flow, as sales numbers, costs of goods sold, overhead expenses and goals are all major components of an accurate cash flow forecast.  You probably track these statistics individually, but have you seen them side by side in one place?  Have you interacted with them and seen how they look overlaid against each other? Visualizations, more commonly known as charts, and a business dashboards not only help keep track of your cash flow fluctuations but also help track the number of months of runway left and which cost factors are affecting your cash flow. Visualizations can illustrate the relationship between multiple data points so that you can get a real feel for your business. Keeping track of monthly cash flow is sufficient for making yearly projections, and visualization software helps you stay on top of your costs day in and day out.
As long as business intelligence and analytics software bring insight and cover essential analytics like gross margin and cash flow, small businesses can only benefit from the technology. It is not overkill at all.  Smart BI for small business works to perpetuate good business practices and helps you achieve optimum insight and efficiency.

Letter to our customers

Dear Valued Customer,
Why Bimotics? Because Bimotics is a small company just like yours, working tirelessly to produce a product that will improve your business and how you think about your business.   We firmly believe that we provide an easy-to-use tool that can help you analyze, refine, and grow your business in a way you never before thought possible.Letter to our customers

How does Bimotics do it? In the same way that you have a special skill, be it making the best cupcakes in town, tailoring the finest suit, or running a high tech distribution network, we have a special skill as well.  Your business is unique, and Bimotics is the unique solution to help you unlock your full potential. We have spent our entire careers figuring out how to bring you the best analytics solution as possible.
We have removed all the challenges that small businesses face when dealing with data through our a la carte menu of analytics.  We have made the analysis of your business as simple as picking items off a restaurant menu.  We have created a true self-service product.
Measure, monitor, and forecast your business at a glance.
Our skills are at your service.  We look forward to your Good to Know! moment.
Sincerely,
The Bimotics Team

Notes From the Road -- What We Learned at the Miami Small Business Expo

What a great week at Bimotics! The entire team got to update their pitching skills, but more importantly put faces and names to the businesses we work to serve each day. We spent two days traveling to small business exhibitions, talking to dozens of local and regional potential customers and fine-tuning our sense of what small businesses need.Notes From the Road -- What We Learned at the Miami Small Business Expo

Here are some key takeaways:
  • People who understand the benefits of business metrics and analysis but “are not there yet” are great for validating our explanation of the value Bimotics brings, but most likely will not fit into the sales cycle we are targeting because it takes a while to set up and use standard business practices.
  • Technology providers that cater to small business are asked quite often where to get analytics and business intelligence systems that fit a tight budget. Possible partnerships and cohort awareness will definitely help us generate leads and grow our business.
  • Demand for business intelligence solutions significantly drops off when solutions reach the $10,000 price point.  Those with higher price tolerance tend to be service-type companies who use analysis as part of their main offering. Bimotics is pricing our service in line with other small business applications.  We also know that we can tap greater demand at a much lower price point.
  • Although technical startups are interested in our analytical software, they tend to fall into the “innovator” rather than the “early adopter” bucket.  What this means is that if we focus on selling just to technical startups, we may not be able to get the critical mass of small businesses we need.  Our goal is to serve all businesses but word of mouth and trust will come easier from non-technical startups, or businesses that are slightly farther along in their development.
Ultimately we left the events with even greater focus on what we need to do to cater to different customer bases and understand how their needs differ.  Our first and immediate post-conventions actions are to schedule product demos with the businesses that expressed interest and continue building local relationships.
Of the dozens of people that we spoke with, all were inspiring.  They were happy to share their stories of success in surmounting challenges in their businesses. They did not complain about budget or about having assembled the perfect team before they figured out a solution.  We were left with a renewed sense of persistence and optimism towards entrepreneurship and providing analytics services that businesses will find invaluable.

Thursday, March 3, 2016

The next natural progression for Healthcare analytics

In building out our services practice, we have made a lot of headway consulting for small and medium sized businesses in the healthcare industry. With the 2015 government mandate to put electronic medical records in the cloud and make patient information more accessible to the patients themselves, we at Bimotics have seen healthcare providers exploring cloud based analytics options. Now that these providers have found ways to store records in the cloud, they are looking for cost effective methods to leverage this data for reporting and analysis.
Healthcare_analytics
With data already in the cloud, healthcare providers are seeing that capital costs needed for more administrative services can be minimized as spending for technology infrastructure such as hardware and structure can be left to the those providing cloud services. Cloud technology also benefits the patients with greater access to their information--even from different specialists and hospitals. With these increased efficiencies and accessibilities, the tangible evidence of cloud’s benefits is speeding its adoption in the healthcare industry.  
Adoption for healthcare based cloud business intelligence and analytics is not without its challenges and obstacles, however. HIPPA compliance, for example,  requires stringent privacy rules and has very serious repercussions when requirements are compromised. There is also much concern surrounding security and data integrity. Solutions can be engineered to address these concerns and we will go into the details of these technical solutions in upcoming blog installments.
Cloud-based healthcare analytics is definitely coming, and coming sooner than some may think.  Given the mandate to place patient records in the cloud and the associated advances enabling holistic patient care, healthcare providers and patients alike will demand equally cost-effective and accessible reports of the services they give and receive.
Related Blogs

Friday, January 24, 2014

Notes From the Road -- What We Learned at the Miami Small Business Expo


What a great week at Bimotics! The entire team got to update their pitching skills, but more importantly put faces and names to the businesses we work to serve each day. We spent two days traveling to small business exhibitions, talking to dozens of local and regional potential customers and fine-tuning our sense of what small businesses need.


Here are some key takeaways:

  • People who understand the benefits of business metrics and analysis but “are not there yet” are great for validating our explanation of the value Bimotics brings, but most likely will not fit into the sales cycle we are targeting because it takes a while to set up and use standard business practices.
  • Technology providers that cater to small business are asked quite often where to get analytics and business intelligence systems that fit a tight budget. Possible partnerships and cohort awareness will definitely help us generate leads and grow our business.
  • Demand for business intelligence solutions significantly drops off when solutions reach the $10,000 price point.  Those with higher price tolerance tend to be service-type companies who use analysis as part of their main offering. Bimotics is pricing our service in line with other small business applications.  We also know that we can tap greater demand at a much lower price point.
  • Although technical startups are interested in our analytical software, they tend to fall into the “innovator” rather than the “early adopter” bucket.  What this means is that if we focus on selling just to technical startups, we may not be able to get the critical mass of small businesses we need.  Our goal is to serve all businesses but word of mouth and trust will come easier from non-technical startups, or businesses that are slightly farther along in their development.

Ultimately we left the events with even greater focus on what we need to do to cater to different customer bases and understand how their needs differ.  Our first and immediate post-conventions actions are to schedule product demos with the businesses that expressed interest and continue building local relationships.

Of the dozens of people that we spoke with, all were inspiring.  They were happy to share their stories of success in surmounting challenges in their businesses. They did not complain about budget or about having assembled the perfect team before they figured out a solution.  We were left with a renewed sense of persistence and optimism towards entrepreneurship and providing analytics services that businesses will find invaluable.

Tuesday, January 14, 2014

SMB behaviors toward Analytics

This week, the Bimotics team is headed to the annual Small Business Expo in Miami, one of the largest of its kind in South Florida, where hundreds will be in attendance. While we are using this opportunity to network and learn more about a wide range of small businesses and their reporting and analytical needs, we will be listening specifically for feedback as to why small businesses feel challenged when using data and analytical information. We will also be listening for reasons that prevent them from investing in metrics/analytics in the first place.

As our products continue to gain traction in the marketplace, it is critical to us to understand what makes businesses continue to use metrics and what causes businesses to stop using them once they have been established and measured. We are advocates on the subject and firm believers in the need for ongoing diligence in monitoring the health of a business through metrics.  
Bimotics has always assumed that the SMB would not adopt and continue to use analytical dashboards as long as they remained complex and expensive.  This is why Bimotics has been so meticulous in our efforts to make sure our designs are easy to use, intuitive and plug and play, and affordable. Our solution hits the sweet spot where specialized (and previously unaffordable) IT is made economical and easy, thereby solving the total cost of ownership challenges most small businesses run into.
We want to ensure that businesses continue to use, enjoy, and profit from business analytics, and we look forward to further validation and feedback at the expo.  In an effort to gain a holistic look at SMBs attitudes toward analytics we will be taking notes on the following:
  • Relevancy of analytics day-to-day operations and long term objectives
  • Sophistication of the organization and the desire for convergence of data across people and teams
  • Financial acumen and overall knowledge of metrics and their uses
  • Preferences for the graphical representation of data
  • Technical skill and quality of in-house data
  • Time and staff devoted to financial and business analysis
We are looking forward to it and we will keep you posted.

Tuesday, January 7, 2014

The true bottom line

What is your bottom line?  
That is the question most everyone running a business is asked. But the exact meaning is often misunderstood as gross profit. Indeed the bottom line is actually net profit or net profit on sales. It is the company's reported income after everything is taken into consideration- taxes, normal operating revenues and expenses, extraordinary charges, and  financial income. Owner value increases as net profit increases by adding to the company’s retained earnings.  At the end of the day net profit is the key metric to answering the question “what’s in it for me”?.
Because net profit represents the bottom line, all business factors drive this number. When analyzing your operations, it is essential to figure out what is impacting your bottom line. Experts have actually recommended that incentives not be based on the net profit metric because they say the average employee (not the CEO) cannot easily tie their day to day tasks to impact on net profit. Since it is an aggregate it blurs individual contributions, it is not meaningful in explaining what one task needs to be done better and thus doesn’t seem controllable. The bottom line should always be reviewed as the roll up of what it happening.
How Bimotics can help:  Your company’s bottom line is easily accessible through Bimotics if you use Quickbooks accounting software. Since we connect directly to the application, bringing in this metric to your dashboard is as simple as selecting it from the Bimotics analytics gallery.  As a summary or roll up metric, you need to look at this metric quarterly.  Analyzing trends your net profit and profit margin on a quarterly basis will give you and your shareholders a good idea on how well you are paying out.

Monday, December 30, 2013

Operating Profit Margin - dig past the financial activities

Operating profit is reported income after revenues and expenses for the company's normal operating business have been subtracted, but before factoring in the contributions of financial income, financial expenses, extraordinary items, and taxes. It differs from gross profit in that all the operating expenses such as legal and distribution expenses are included.
For the business founders and owners, operating profit represents what is available to them before a few financial items need to be paid out including preferred stock dividends and taxes. Generally though, ample operating profit shows that your company is either well run with the right amount of cost controls, or that competitive forces are weak against your offering. Strong operating profits also enable the use of capital to do more whether it is adding features to your software application or making you checking process more seamless.  Note: when looking at analytics for operating profit, it is important to keep in mind that this metric can fluctuate widely especially for companies impacted by seasonality.
Operating profit expressed as a percentage of net sales revenues is referred to as operating margin, a measurement for management’s efficiency and quality of a company’s activities against its competitors. If your business is going high volume and low cost, then operational margins should be on your list.  Note: this metric can be skewed by showing strong margins that came by taking on significant debt, which puts the business at risk.

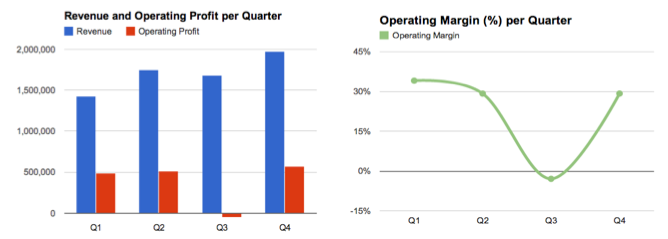
Many analysts and business owners alike call operating profit among the key business metrics to evaluate a company’s performance.  Visualizations can be evaluated by looking a revenue next to operating profit or a trend line showing operating margin.

Tuesday, December 24, 2013

Letter to our customers

Dear Valued Customer,

Why Bimotics? Because Bimotics is a small company just like yours, working tirelessly to produce a product that will improve your business and how you think about your business.   We firmly believe that we provide an easy-to-use tool that can help you analyze, refine, and grow your business in a way you never before thought possible.


How does Bimotics do it? In the same way that you have a special skill, be it making the best cupcakes in town, tailoring the finest suit, or running a high tech distribution network, we have a special skill as well.  Your business is unique, and Bimotics is the unique solution to help you unlock your full potential. We have spent our entire careers figuring out how to bring you the best analytics solution as possible.

We have removed all the challenges that small businesses face when dealing with data through our a la carte menu of analytics.  We have made the analysis of your business as simple as picking items off a restaurant menu.  We have created a true self-service product.

Measure, monitor, and forecast your business at a glance.

Our skills are at your service.  We look forward to your Good to Know! moment.

Sincerely,

The Bimotics Team

Tuesday, December 17, 2013

5 Gross Margin metrics and how they matter


Profit and loss is reported in every business through the income statement.  It is here that profit metrics can be created which can help a company assess its health over time.  Bimotics makes this analysis easy.  Especially in the case small and medium sized businesses, gross profit and operating profit analysis can help determine whether a company is executing on their core activities and what their next steps should be.


For example, gross profit is used to understand gross margin. Over time, if gross margin decreases, that implies that production costs are rising faster than sales. This trend signals that the company will need to increase cost controls and/or look for options to improve sales. When working with companies, we  have seen it time and again -- investors get concerned when profit margins are too low, indicating key weakness in the business model.


There are different ways to learn from the gross margin metric and leverage the power of Bimotics.  Following are a few examples:
 
  1. Gross margin by product/service line: This lets you see which products or services bring you the greatest profit per unit. This analysis helps you identify the level of impact your products have on the bottom line.  You can use this information to help you decide, for example, if a product line is worth developing or phasing out or what campaigns are needed to improve a product line’s performance.  
  1. Overall gross margin over time: This lets you see how sales and costs impact a product over a period of time. Trends can be measured and predicted taking into account external factors such as inventory headwinds and internal factors such as cost of inventory storage. Controlling or counteracting these factors can keep margins at a healthy level.


  1. Gross margin by team: This lets you see how different working teams within your organization manage sales and costs. Depending on the objective of each team, you can compare and learn how they managed resources to meet particular goals.  This metric is used for learning events.


  1. Gross margin by customer type: This lets you see which kinds of customers are impacting your profit and suggest price points that each type of customer will be willing to pay. Use the metric to decide if and how a particular product should be introduced and marketed to a certain customer segment.
  1. Gross margin planned vs. actual: This is a good benchmarking tool that helps you analyze how well actual business measured up to what was forecasted.  The difference between the two gives you a starting point on where to delve deeper into the factors that are really impacting your business.  What did you not take into consideration that you were supposed to?  Are you meeting your goals?


In summary, gross margin is a key profit metric that every business needs to understand and track because it illustrates the relationship of sales and costs and is impacted by many facets of your business ranging from team and operations, to customer and product.

Bimotics allows you to easily and meaningfully analyze gross margin, and help you to fine tune and grow your business

Tuesday, December 10, 2013

Visualizing profit and profit trends

In the previous blog, we discussed how profitability and long term value are the main goals for small and medium sized businesses.  With this in mind, the ability to analyze and understand your profit is growing increasingly important. With a little research, you will find a great variety of visualizations or charts for analyzing profit. Most may look “cool” but are not very easy to read or insightful.


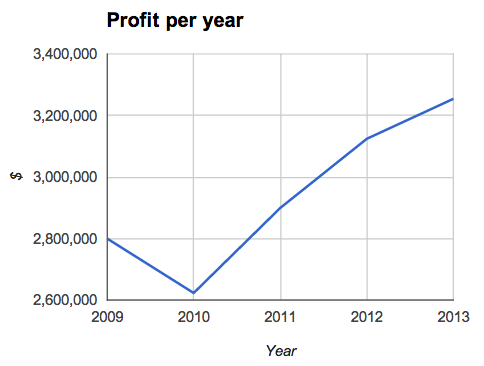
At Bimotics, we recommend that when looking purely at profit over time, a line chart best displays profit trends.  A line chart is best suited for analyzing patterns over a time series. It helps you understand historical and current trends, seasonality, and repeatability.  It also provides support for comparison while evaluating your data against other variables such as product or service type, sales, store, geography, and customers.


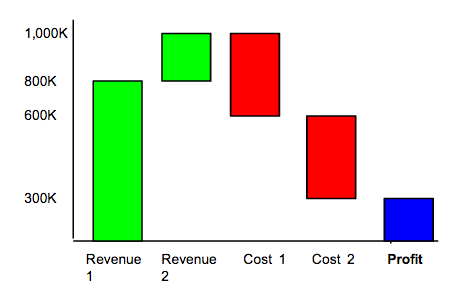
A bar chart can also depict changes in profit over time, however according to Stephen Few, each bar chart should need to start at zero. Take the contrast such as a waterfall chart.


Although the details of revenue and costs are important and can be visualized in the chart above, this chart is confusing, requiring you to figure out its meaning. The chart expects you to do the subtraction of costs from revenue may miss suggest that profit is too small compared to profit.

Returning to the first line chart developed in Bimotics, you can see how choosing the right visualizations allow you to easily and quickly build meaningful comparisons that help you unlock the power of your data.  Comparing and forecasting have never been easier for your small and medium sized business.