Monday, December 30, 2013

Operating Profit Margin - dig past the financial activities

Operating profit is reported income after revenues and expenses for the company's normal operating business have been subtracted, but before factoring in the contributions of financial income, financial expenses, extraordinary items, and taxes. It differs from gross profit in that all the operating expenses such as legal and distribution expenses are included.
For the business founders and owners, operating profit represents what is available to them before a few financial items need to be paid out including preferred stock dividends and taxes. Generally though, ample operating profit shows that your company is either well run with the right amount of cost controls, or that competitive forces are weak against your offering. Strong operating profits also enable the use of capital to do more whether it is adding features to your software application or making you checking process more seamless.  Note: when looking at analytics for operating profit, it is important to keep in mind that this metric can fluctuate widely especially for companies impacted by seasonality.
Operating profit expressed as a percentage of net sales revenues is referred to as operating margin, a measurement for management’s efficiency and quality of a company’s activities against its competitors. If your business is going high volume and low cost, then operational margins should be on your list.  Note: this metric can be skewed by showing strong margins that came by taking on significant debt, which puts the business at risk.

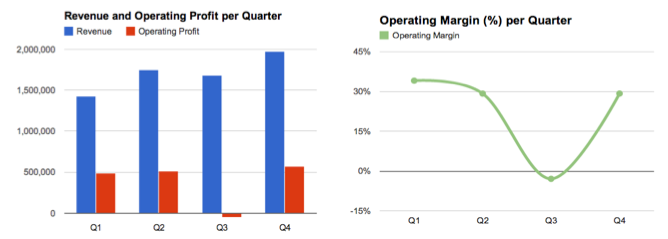
Many analysts and business owners alike call operating profit among the key business metrics to evaluate a company’s performance.  Visualizations can be evaluated by looking a revenue next to operating profit or a trend line showing operating margin.

Tuesday, December 24, 2013

Letter to our customers

Dear Valued Customer,

Why Bimotics? Because Bimotics is a small company just like yours, working tirelessly to produce a product that will improve your business and how you think about your business.   We firmly believe that we provide an easy-to-use tool that can help you analyze, refine, and grow your business in a way you never before thought possible.


How does Bimotics do it? In the same way that you have a special skill, be it making the best cupcakes in town, tailoring the finest suit, or running a high tech distribution network, we have a special skill as well.  Your business is unique, and Bimotics is the unique solution to help you unlock your full potential. We have spent our entire careers figuring out how to bring you the best analytics solution as possible.

We have removed all the challenges that small businesses face when dealing with data through our a la carte menu of analytics.  We have made the analysis of your business as simple as picking items off a restaurant menu.  We have created a true self-service product.

Measure, monitor, and forecast your business at a glance.

Our skills are at your service.  We look forward to your Good to Know! moment.

Sincerely,

The Bimotics Team

Tuesday, December 17, 2013

5 Gross Margin metrics and how they matter


Profit and loss is reported in every business through the income statement.  It is here that profit metrics can be created which can help a company assess its health over time.  Bimotics makes this analysis easy.  Especially in the case small and medium sized businesses, gross profit and operating profit analysis can help determine whether a company is executing on their core activities and what their next steps should be.


For example, gross profit is used to understand gross margin. Over time, if gross margin decreases, that implies that production costs are rising faster than sales. This trend signals that the company will need to increase cost controls and/or look for options to improve sales. When working with companies, we  have seen it time and again -- investors get concerned when profit margins are too low, indicating key weakness in the business model.


There are different ways to learn from the gross margin metric and leverage the power of Bimotics.  Following are a few examples:
 
  1. Gross margin by product/service line: This lets you see which products or services bring you the greatest profit per unit. This analysis helps you identify the level of impact your products have on the bottom line.  You can use this information to help you decide, for example, if a product line is worth developing or phasing out or what campaigns are needed to improve a product line’s performance.  
  1. Overall gross margin over time: This lets you see how sales and costs impact a product over a period of time. Trends can be measured and predicted taking into account external factors such as inventory headwinds and internal factors such as cost of inventory storage. Controlling or counteracting these factors can keep margins at a healthy level.


  1. Gross margin by team: This lets you see how different working teams within your organization manage sales and costs. Depending on the objective of each team, you can compare and learn how they managed resources to meet particular goals.  This metric is used for learning events.


  1. Gross margin by customer type: This lets you see which kinds of customers are impacting your profit and suggest price points that each type of customer will be willing to pay. Use the metric to decide if and how a particular product should be introduced and marketed to a certain customer segment.
  1. Gross margin planned vs. actual: This is a good benchmarking tool that helps you analyze how well actual business measured up to what was forecasted.  The difference between the two gives you a starting point on where to delve deeper into the factors that are really impacting your business.  What did you not take into consideration that you were supposed to?  Are you meeting your goals?


In summary, gross margin is a key profit metric that every business needs to understand and track because it illustrates the relationship of sales and costs and is impacted by many facets of your business ranging from team and operations, to customer and product.

Bimotics allows you to easily and meaningfully analyze gross margin, and help you to fine tune and grow your business

Tuesday, December 10, 2013

Visualizing profit and profit trends

In the previous blog, we discussed how profitability and long term value are the main goals for small and medium sized businesses.  With this in mind, the ability to analyze and understand your profit is growing increasingly important. With a little research, you will find a great variety of visualizations or charts for analyzing profit. Most may look “cool” but are not very easy to read or insightful.


At Bimotics, we recommend that when looking purely at profit over time, a line chart best displays profit trends.  A line chart is best suited for analyzing patterns over a time series. It helps you understand historical and current trends, seasonality, and repeatability.  It also provides support for comparison while evaluating your data against other variables such as product or service type, sales, store, geography, and customers.


A bar chart can also depict changes in profit over time, however according to Stephen Few, each bar chart should need to start at zero. Take the contrast such as a waterfall chart.


Although the details of revenue and costs are important and can be visualized in the chart above, this chart is confusing, requiring you to figure out its meaning. The chart expects you to do the subtraction of costs from revenue may miss suggest that profit is too small compared to profit.

Returning to the first line chart developed in Bimotics, you can see how choosing the right visualizations allow you to easily and quickly build meaningful comparisons that help you unlock the power of your data.  Comparing and forecasting have never been easier for your small and medium sized business.  

Tuesday, December 3, 2013

Startups vs Small Business: Bimotics Perspective


Every once in a while I come across blogs and articles on the difference between startups and small businesses. The distinction between the two is that a successful startup is expected to grow exponentially from small beginnings, to attract customers rapidly, and hopefully grow to serve a very large market.  Startups are therefore a much smaller set of small businesses. In contrast, small businesses typically have a viable business and customer base in place and their needs are slightly different as a result.  Bimotics has been evaluating and analyzing this dynamic and this is reflected in the operational and financial dashboards that Bimotics builds.

My first impression was that the dashboard of a startup and a small business would be the same-- the slope of lines and the amplitude of the y-axis on some of the charts would be able to share the same visualization framework. Is it not true that all businesses should grow?  The trajectory of a startup would just be steeper right? At their essence, don’t all businesses share similar foundational forces of accounting and operations?

While I’m not wrong, Neil Thanedar wrote in a 2012 Forbes article that specific focus of each business type would drive different analytics in a dashboard. He explains that small businesses are driven by profitability and stable long-term value, while startups are focused on top-end revenue and growth potential.  

Profit is basically calculated by subtracting Total Costs from Total Revenue. While Top-end Revenue is calculated by subtracting just Total Discounts and Returns from Total Revenue.

A small business focusing just on top-end revenue would be disastrous as it does not address the need for sustain long-term value. Profitability is a better analytic as it takes in account costs and gives a business owner indication of sustainability. As long as small business is making a profit, it will continue to survive.

Although cost is important when a startup in evaluating available runway, it is not used when focusing on how the business is performing.  Top-end revenue tells the founder what it takes to make sales. Against defined specific sales tactics, the founder evaluates what makes people buy and how to attract more sales. This insight is key for accelerated growth of a startup to capture that larger market potential.

Even amongst businesses of small size, it is important to understand how focus can drive different monitoring and analytical needs.  Although there are business fundamentals that all businesses need to adhere to, at the owner level, dashboards are not one-size fits all.

Bimotics is tailored to suit the needs and unlock the potential of companies from the emerging startup to the growing small and medium sized business.

Tuesday, September 24, 2013

Data marts, Analytics marts and Dash marts, Part 3 of 3

As described in our first part of this 3 part series, dash marts are the culmination of the data marts and the analytics marts. The dash mart is a concept from Bimotics that allows to integrate multiple analytics marts into a dashboard. But, what is new about this? Although most dashboards are a collection of charts and tables organized to provide a specific view to your business. The dashmart is not. A dash mart is more than a template. Bimotics dashmarts are built on top of data marts and analytics marts. Through categorizations and a strong understanding of business dependencies and relationships, the dash mart weaves together dashboards together for a more meaningful view of the big picture. We have built you a smart asset to win over your competition by combining the three concepts- data marts, analytics  marts and dash marts.
Dash marts leverage data marts as their foundation, as described on our series (Part 1: data marts). Data marts integrates convert and make easy for consumption the information from applications use by business like Quickbooks, Freshbooks and SalesForce.
As described also in the second part of this series (Part 2: Analytics Marts) the analytics marts, is at this level where business can gather real insight about meaningful questions related to a data mart. Here looking at each individual chart is key. Multiple insights can come by just looking at one analytic-one core measurement. For more an example using sales representative profitability see our first white paper.
The dash mart provides the “Aha! moments”, while analytics marts provide very meaningful insight they are limited by the data mart. With dash marts you are free to use analytics from multiple data sources on demand and most important provide the big picture to business. They are bound by filters that cross analytics through a common fiber. For example, dash marts that combine analytics from finance and CRM could generate very complex scenarios in a very simple way to analyze them. First, mixing financials with a CRM is the only way you can get sales representative profitability. In the same view, combine the your sales funnel from leads to cash.  Layer in product velocity vs. profit impact. Now you have the richest sales dashboard possible.
Our dash mart enables a forward view of your business- no more reliance on snapshots and historics. It also allows to monitor while you run it. Please checkout how Bimotics implements dash marts and how they could help you.

Friday, September 13, 2013

A case against the spreadsheet mindset

Recently, I was having a conversation with a seasoned visualization (dashboard) specialist. I asked this person, “What is the biggest challenge in getting users to adopt a visualization technology?” I was expecting to hear that there was a lack of skills around being able to build complex queries; or experiencing complicated steps in configuring the dashboard user interface, graphs and charts.  The answer truly surprised me.


He answered that the biggest barrier was the spreadsheet mindset. Even with advanced technology available to them, most users struggle with trusting and analyzing data outside of tables full of data points and looking at the raw numbers instead.


He went on to explain that he provided the same dashboarding tool to multiple users-  engineers, sales, and finance employees conducting multiple training sessions and providing examples for them to reference. The engineers produced highly graphical "cool charts" but these analytics were complex and hard to understand. The finance employees, number experts, replicated their excel spreadsheets and did not add any visualization- stating that was easier to see the numbers in tables.  Finally sales provide a mix of both traditional tables and simple charts.  


I was surprised how users are much more trusting and comfortable with tables of numbers rather than visualizations like charts and counters.  Numbers are great when looking into a specific value, but they inhibit analysis and blur the “big picture”. The best example that illustrates how charts enable more insights quickly, I learned from the most respected person in the industry, Stephen Few.


Imagine a table with 12 columns representing the months and 20 rows each with the sales by product line.  Now try to answer the following questions in less than 5 seconds:


1. Which product has the highest and lowest sales?
2. Is there any seasonality per product?
3. What is the overall sales trend?
4. Which month yielded the highest sales?
5. Are there any anomalies over the time period being analyzed?


Now imagine a line chart graph, based on the same dataset. Now go back and try to answer the same questions.


Were you able to analyze the information faster in visual format (chart) or table format? Were you able to answer them in less than 5 seconds?  I’m confident that the insights gained from the chart were both easier to obtain and more efficient in providing the answer.  What do you think?

Thursday, September 5, 2013

Evolving from data marts to analytics marts - part 2

In our previous blog entry, we illustrated the value of data marts over complex spreadsheets.  While data marts help you and businesses focus more on analysis and less on dealing with raw data, they are just one foundational building block of a smart business.  
Data marts benefit businesses by converting often-immense source data from multiple subject matter silos within a business (eg. operations and/or finance) into a  more user-friendly product that is easier to analyze by the end-user. Getting usable data is key, but to have a truly intelligent business, metrics and analytics need to be defined and applied.
Bimotics asked the question, ”How can data marts be made even more streamlined?  Refined?  Intuitive? Can they provide answers to questions customers had not even asked yet?”  

Enter analytics marts – the evolution of the data mart.  The analytics mart is a concept pioneered by Bimotics that provides great analytical insight into information gathered from data marts through a gallery of plug and play charts that automatically adjust to your data, and most importantly, your business. From the moment you fire up the Bimotics console, you have ready to use analytics available at your fingertips.  The below image conceptually depicts how the analytics mart works.  Instead of having to build each chart from scratch and figure out the appropriate visualization for the information you have, simply click on the pre-built chart 
you want.


Analytics marts are individually tailored groups of business essential analyses that can be gathered from one or more data mart.  At Bimotics, these analytics come pre-packaged into categories like customer analysis, profitability and financial performance.  This categorization into intuitive grouping is at the heart of the analytics mart concept- pick and choose the charts and metrics built from your data marts that make sense and align with the business strategy and model of today.  Change them as quickly as your business transforms. Be agile!  If you are looking for revenue performance, for example, we have provided the metrics and charts  in the financials category .  You can also search analytics by tags such as revenue and financial performance.

The bottom line is that analytics marts allow you to focus your efforts on the actual analysis and gaining of insight instead of fretting over building charts. The visualization itself also aids  in the quick evaluation of your data.  It allows you to look at your information from multiple angles quickly and efficiently. Analytics marts are essential for detailed analysis, Key Performance Indicator (KPI) monitoring, and applying operational insight to process control.

The third part of the series ties it all together. Bimotics introduces the concept of the dash mart, an approach that combines analytics marts and data marts to give you an extraordinary view of your business.   

Friday, August 23, 2013

Moving from spreadsheet marts to data marts

Currently every business, regardless of size, uses some sort of spreadsheet technology like Microsoft Excel, Apple Numbers or Google Docs Spreadsheets to analyze, review and report business operations and performance. They create tons of multiple versions of the same documents and the most sophisticated users generate spreadsheets using data from different applications, such as combining information from ERP and CRM systems to conduct analysis and draw conclusions.

This is a daunting task that is prone to errors due to its manual nature. Unfortunately, businesses seldom have a better choice or motivation to switch away from the way they have been running operations for years, which is particularly the case with small and medium businesses. There are several problems associated with running your business on spreadsheets. They are hard to maintain, tedious to update and their intended result can shift, losing focus of the original purpose for generating such representations of business data.

Businesses spend most of their time gathering data points, matching up information from different sources, cleansing the data from what you do not need, joining pieces and trying to understand how applications process this information to help drive decisions. A large amount of time is also spent fixing mistakes and validating what has been built. This leaves little time to actually conduct the necessary analyses and apply insights to actual business performance.

The common IT solution for “spreadsheet hell” is the use of data marts. A data mart is an access layer sitting on top of the data warehouse the gives data access to users so they can resolve most of the issues they experience with spreadsheets. Getting a data mart is not simple and requires a series of technical components such as connectivity, access, extraction, transformation, loading, cleansing, mapping and data aggregation at the source applications.

By using data marts, business users do not need to do any of the tasks involved in terms of maintenance and data massaging. Technology experts pre-develop processes to access and extract information from applications. Data architects then transform the data giving it business friendly meaning. The result is that any business user could use and understand the data. This proven IT process also verifies that the data matches and maps to other applications. Finally in data marts, only the most meaningful metrics are aggregated like amount, quantity, unit cost, hours and cost, enabling a better sense of the business.
Data marts do all the work so that business can focus more on analysis instead of dealing with the raw data. Reducing data silos, human error, and most of all the tedious, time-consuming effort is essential to making important business decisions: decisions that impact the bottom line. However, data marts are just one part of the puzzle.


In the next segment we will describe the limitations of data marts and how analytics marts and dash marts will be the next evolution in the progression of business intelligence. 

Wednesday, August 21, 2013

Is enterprise ready for Analytics Marts?

Observing consultants and IT organizations implement large business intelligence solutions, I find often that the first project either fails entirely or never gets past the initial phases. Lessons learned from these setbacks are often rooted in the client/ business not knowing the data they really want or political battles over which information and metrics are most important. Technical architects have avoided such battles by instead providing data marts, so that managers can help themselves to any data and build metrics in a self-service manner. By giving the client or business everything, the problem is solved.


But does this approach really help the business in the end? No.  Managers remain misaligned serving their best guess of what will get them praise instead of addressing the true business need. Internal to the organization, data proliferation occurs where meanings get blurred and maintenance is so difficult even labels lose their original purpose of a sufficient description. Data silos of big data proportions are saved per division which is wasteful and duplicative.


Generally, I am describing an enterprise problem. Small and medium-sized businesses (SMB) suffer less from these political problems as they cannot afford much system customization and the resources needed to maintain it. Instead the SMBs tend to stick with the standard and best practice fields and data points. Because of this, Bimotics can provide our customers a solution we call the “gallery of analytics”. This gallery hosts all the business analytics available given the operational and financial application data marts for which the customer has data.  Generally, these pre-built analytics reflect best practice operational and sales processes that are fundamental in all business looking to grow. The image below is an example of what the analytics gallery looks like. 
The value to business owners is that they do not need to know what metrics they want before they bring on analytics. Instead they pick and choose the available analytics that makes sense to answer a particular business problem. They also can prioritize these analytics based on the business strategy they laid out.  If the business changes direction, then the business owner can change out the analytics to reflect this new vision. Not having to go back to the drawing board saves precious time. This gallery approach to analytics puts the definition and the prioritization of metrics and at the end as well as provides breadth and flexibility to a manager.  


Can this same principle be applied to solve an enterprise problem? Although very complex to build, can an “analytics mart” based on only the standard fields and best practice processes of major enterprise applications such as SAP, Oracle, Microsoft and SalesForce be built using the similar principles as our “gallery of analytics”? This “analytics mart” would cut across the different platform so that advanced metrics are available. For example, metrics, like support center effectiveness, are shown as a blend of financials in SAP with support data from Siebel. This proposed approach solves one of the greatest barriers that keep enterprises from successfully implementing business intelligence, by defining what to measure up-front, avoiding the interdepartmental politics in its allegiance to only standard and best practice processes.


Why haven't companies implemented "analytics marts" already? The answer is twofold.  First building an analytic mart across enterprise systems houses many technical complexities especially when looking at all the software versions and system customizations that exist per enterprise. This is not to say that a solution is technically impossible however.  Second, budgets split by division and departments need to be continuously spent in full which enable data silo behavior over cross department collaboration and process analysis. In other words, large organizations have budgetary policies that encourage managers to make blind purchasing decisions.   How much of a fundamental shift would need to occur in an organization to embrace the sharing of data and metrics sharing?

The key to customer adoption of the “analytics mart” rests on a consolidated drive to improve your business and the willingness of managers collaborate holistically. Will enterprise managers have the courage to allow themselves to be measured against fundamental business process standards, in addition to evaluating how well their assigned divisions support the overall corporate strategy?

Wednesday, August 14, 2013

Participating in a shark tank

Since it was recently Shark Week, I felt compelled to dedicate one blog post to my experience pitching Bimotics in a shark tank. Investment groups, entrepreneur clubs and academic programs have all jumped on this trend of hosting business shark tanks. Active entrepreneurs that seek funding from outside investors these days, most likely will find themselves preparing for our actually pitching in a shark tank.


It is especially important that an entrepreneur to have their startup story crisp and solid.  I have found that talking to individual investors will be a be more inquisitive and casual in talking about your business. But in the tank, the story needs to fact based and all the latest numbers and metrics rolling off your tongue effortlessly.  Although passion for your business is important, there is less time to convey it.

The sharks in the tank may not be evaluating your business under the same criteria.  Some may be looking for only early stage business. Others could be looking for strictly B2Cs. Others are looking for that one story that is missing from their portfolio. This makes it hard to because you cannot tailor your message just the one investor or topic of interest. If you have the luxury to know the background of each perspective shark, I would just tell the story targeting the very most one you want.

It is rare that your startup will get all the investors to be frenzied over you. The businesses that do are special enough to have their story told on business insider. Just like a shark attack on the beach, its uniqueness is why its news. However, it just takes the one right investor to make it all worth it.

Monday, August 12, 2013

Arriving at the tag line, Good to Know

When we first started Bimotics, co-founder and I continuously refined our with the story and sought to find efficient ways to describe our business. We took the approach of talking to as many people as we can. Not just the target customer, but also potential investors and professionals. In all honesty, the task was amongst the most frustrating things we have had to do for Bimotics. To my defence, you try to explain what business intelligence is to a small business owner.  

Last year, I was traveling back from visiting my parents. I stopped at the Barnes & Noble to buy a paperback for my flight. (I generally travel with one tablet reader and one paperback; so that I can continue to read during takeoff and landing.) Since I was in the prime of my frustration, I bought, Words That Work: It's Not What You Say, It's What People Hear by Frank I. Luntz.  It turned out to be an amazing book that i couldn’t put down until arriving back in Miami.


Luntz tells us that a good tag line should be between three and four words. For business, it should conjure a positive emotion and be associated with what one could experience using your product. A good tag line could was also something that you could hear in everyday conversation.  
I sat through the flight listing different possible tag lines for Bimotics. I tried lines that would be associated with being empowered or becoming stronger and smarter. I tried clever and witty lines about digging through and using your data. Then there was an announcement on our flight saying that we were a little delayed a bit and what number our baggage carousel was going to be when we landed. The boy across the aisle me put down his iPad, took off his headset then leaned over to his mom and said, “Good to know.” IT WAS PERFECT!

Good to know is a common expression used when you learned something that will be particularly helpful to you. It is used to communicate appreciation, pleasure or relief about knowing something you previously did not. That is exactly the mission of this startup.  At Bimotics, our metrics, analytics and dashboards will point to revelations about a business’s operational health and financial performance. We want our customers to say “Good to Know!” when they use our software and learn something from their own analytics. Whether it is saving money, going after better markets or laying out a different operational strategy, our products can support these decisions.


Our tag line has been Good to know ever since.

Friday, August 9, 2013

Our marketing campaign: Essential Analytics

Recently, I just finished updating our first white paper for BimoticsEssential Analytics campaign. From concept to fruition, this milestone took much more time and effort than I expected- nearly a year. Much time was spent understanding what my potential customers, the small and medium sized business really need to know about analytics.  

After wading through topics about why metrics do not work for small business such as not having the know-how to set up metrics let alone time to look at metrics and having low data quality with the applications. (Problems our software also solves but makes us sound like IT folks.) I was wanted to focus on bringing value to those that were already open to metrics and analytics, but perhaps needed more practical advice on how to apply it. The response from potential customers that stood out and fit with my goal was: There is not enough context on when it is appropriate to use one metric or KPI.

As a practicing business analyst, gaining insight from the data and measurements comes more naturally. But observation has shown that many small and medium sized businesses do not have a seasoned business analyst to “read the tea leaves”. Even our early adopters, can struggle with making sense of the numbers. Once an organization has the ability to measure their business operations and performance. Questions immediately arise:
  • Does this metric make sense for my business model?
  • Does this metric make sense for my industry?
  • Which of these metrics are more important?
  • What does the analytics even mean to my business?
  • Do these metrics even align with my current strategy?

From this research, I worked on the design for my for Essential Analytics marketing campaign. The white paper series will showcase one key business metric that one can get out of our first data sources: Quickbooks and Freshbooks. Then, we use business cases to describe how other managers and business owners use the metric to get solutions to everyday business problems. Our readers can get both more context around metrics and how they can be used, as well as, come up with ideas on how to use analysis to answer their own questions.

Thursday, August 8, 2013

KPIs: Sales Representative KPIs

I have spent some time recently looking at Sales Representative Profitability and the types of analysis that can be done to make firmer business decisions. Another method is the use of KPIs. KPIs stand for key performance indicators which are measurements a business takes to monitor performance.

In setting up a performance based sales organization, managers and small business owners can create KPIs for their sales representatives.  According to the KPI Mega Library, there are a few related to the sales representatives. These can be categorized in 3 ways:

  • Day-to-day sales activities:
    • # of average appointments per sales representatives
    • Time to answer a request by customer
    • # of customers per sales employee
  • Sales revenue measurements:
    • Average sales revenue per sales person
    • Total costs to gain a new customer
  • Sales team performance:
    • Average sales turnover per sales staff
    • % of sales representative that met or are above quota
    • % of sales representatives that have met sales target
    • Total sales of sales staff / Total customers of each sales staff

It takes continuous measurements of these KPI to understand how well your sales team can performance as well as how much they can improve.  After several measurements you can start looking at trends. This is the easiest way to analyze the performance and changes.

Tuesday, August 6, 2013

Design Thinking: Observing Extreme Users 2

Continuing the learnings from the Design Thinking training, figuring out who will be the extreme users of Bimotics is similar to the hypothesis of our early adopter customers. It is not a stretch to assume that those that are currently measuring and analyzing business would be the the most likely early adopter and positive extreme user.  On the other side of the spectrum, the extreme users that are least likely to use our products are those with either low data quality as poor quality adversely impacts the effectiveness of analytics or hidden agendas that is not supported by the data.


The things I would like to observe from our extreme users that love our product and find value in our features include the categories of analytics that mean most to them.  Are they leveraging topics related to sales and marketing over supply chain and finance?  How are they using the customer flows we designed? To navigate to and from analytics and dashboards, are they taking necessary steps to get around? I have learned from other software entrepreneurs that small business “use copy” and paste more often than using “new” in order to avoid typing in the same information over and over. Finally, I would like to know on what devices they access our application. Our product is mobile enabled; and we have taken care to so that our infrastructure supports mobile.  I would like to know if it was worth it.


Something to observe related to the extreme users who don’t use or even dislike our product, it whether or not they go to their teams and applications and work to improve data quality.  Are there initiatives or trainings that makes their resources input better information?  For those whose agendas don’t have data to support their decisions, I would be very interested in seeing and understanding how communication is done to other team members and whether they get push back from the others with access to the same analytics.  

I’m sure there are other groups of extreme users.  And the identification of extreme users can extend past product users.  For example, those that read this blog would be not segmented by product customer buy rather by prospect or investor.